
Many of us at Xyonix are soccer players, parents of soccer players, or just plain huge fans. With the recent excitement of the 2019 FIFA Women’s World Cup, and the success of the U.S. Women’s National Team, we got inspired to try and apply advanced AI techniques to soccer. In recent years, advances in artificial intelligence have made it possible to automatically detect and segment objects of interest in static images and track those objects over time in recorded video. In addition, AI breakthroughs in body pose estimation, or the automated extraction of a skeleton for each frame in a video, have enabled the possibility of gathering detailed metrics for an activity, tracking them over time, and applying an array of analysis. We decided to focus on penalty kicks, which statistically speaking, put goalies at a strong disadvantage: PKs result in a goal being scored scored more than 72.5% of the time in most international competitions [1]. The question we asked is
can we better an individual goalie’s chances of stopping a penalty kick with advanced AI?
We begin with a simple video, recorded by one of our interns using a modern phone at a local park. We next apply some keypoint estimation techniques to isolate select points on the body. We also focus on transforming the video imagery to real world coordinates.
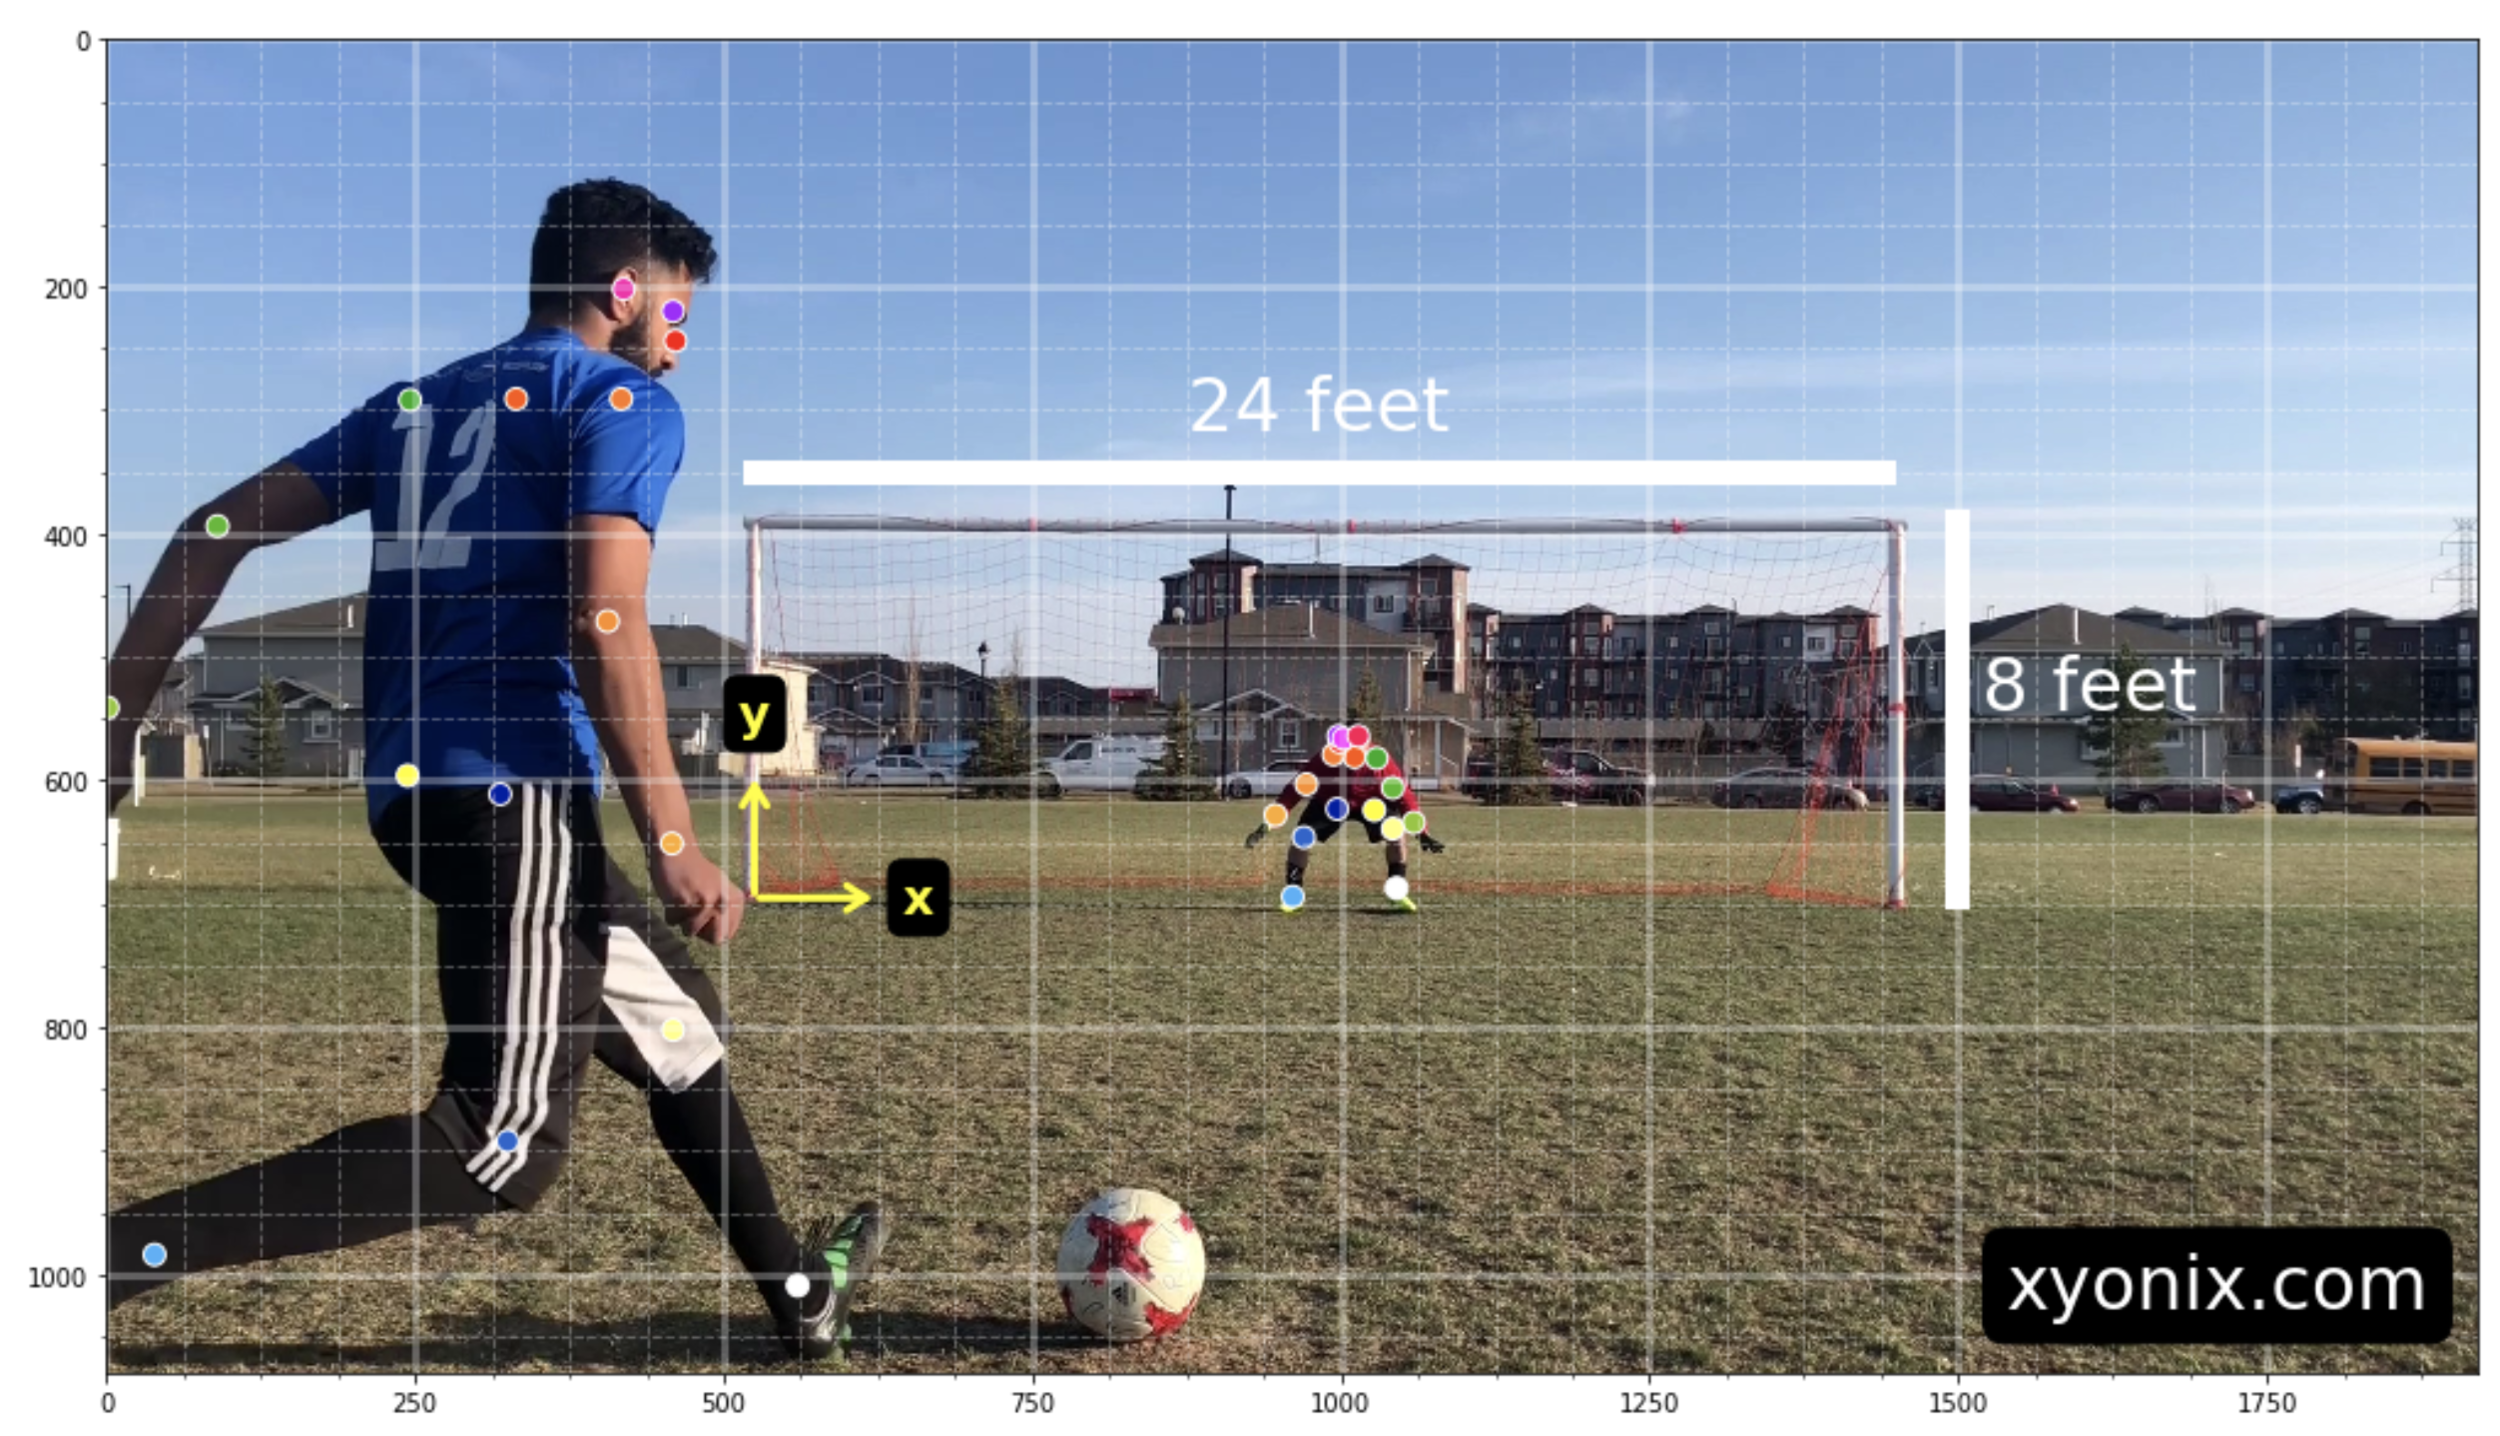
Figure 1: Keypoints on players depicted along with real world size references.
In Figure 1 above, we see pose estimated keypoints are automatically detected by our models for the goalie and kicker. The base of the left goal post defines our origin for our real world coordinate system. Not shown is the z (depth) component, which extends towards the viewer and away from the goal.
Next, we wish to extract the ball trajectory during the kick. This will allow us to gather metrics on the ball such as its velocity, as well as allow us to move aspects of the scene into a virtual environment for closer inspection from different angles as well as simplified viewing.
The motion of the soccer ball can also be estimated using ball detection and semantic segmentation models. However, these models are not perfect and, in fact, for many of the video frames the ball is not even detected. To fill in the gaps between frames, we employ advanced computer vision techniques such as optical flow (to predict the motion of the ball from one frame to the next), and geometry-based feature transformations (Hough circles), and basic physics involving the projection of the coordinates from a 2D pixel surface into a 3D real world coordinate system (Figure 4).

Figure 2: Semantic segmentation of players and ball depicted.

Figure 3: Semantic segmentation of players depicted, but ball is not segmented.
In Figures 2 and 3 above, we see an illustration of this problem. Figure 2 shows a frame where the goalie, kicker, and ball are well isolated. However, in the frame depicted in Figure 3 the soccer ball remains undetected.

Figure 4: Transformation mappings from 2D video frame coordinates to a 3D coordinate depicted.

Figure 5: Soccer ball trajectories in real world coordinate before, during, and after impact.
The ball trajectories detail a dramatic impact event with the ball rapidly approaching the goal line from 36 feet out in less than half a second, traveling at an average speed of approximately 46 mph as the ball hurtles towards the upper right corner of the goal.
Our goalie is fortunate, in professional leagues, PK shots can reach speeds up to 80 mph with the ball crossing the goal line within approximately 0.3 seconds [2].
Next lets look at keypoint movement over time. Keypoint velocity fields aid in visualizing the flow of motion over time, highlighting parts of the body that are active or dormant and that follow an erratic or consistent path. Figure X shows a keypoint velocity field for the goalie from the time the ball is impacted to when it crosses the goal line during the penalty kick.
Each arrow is a frame-based snapshot of position and velocity: the beginning of the arrow indicates a keypoint’s position in the plane of the goal while the tip of the arrow is a “one second ahead” projected location, given its current path and speed. Therefore, the longer the arrow, the faster the keypoint is moving in the indicated direction. We can see, for example, that
the goalie’s right wrist follows a consistent path to the right and upward with an increasing burst of speed in an effort to reach out and stop the ball.
Other keypoints, such as the goalie’s left and right knees, show more erratic paths as the goalie settles into position prior to jumping for the ball. Figure X+1 shows a similar plot but with the keypoints placed into mean aggregated groups, which summarize the motion of larger portions of the goalie’s body. Visually, the torso and the head exhibit highly correlated motion, which makes sense given that they are semi-rigidly connected. An interesting hysteresis-like pattern is exhibited by the left and right arm with leftward pointing velocities engaged to maintain balance and/or to put the arm(s) into better position to absorb the impact as the goalie plummets back to Earth, having missed the ball.
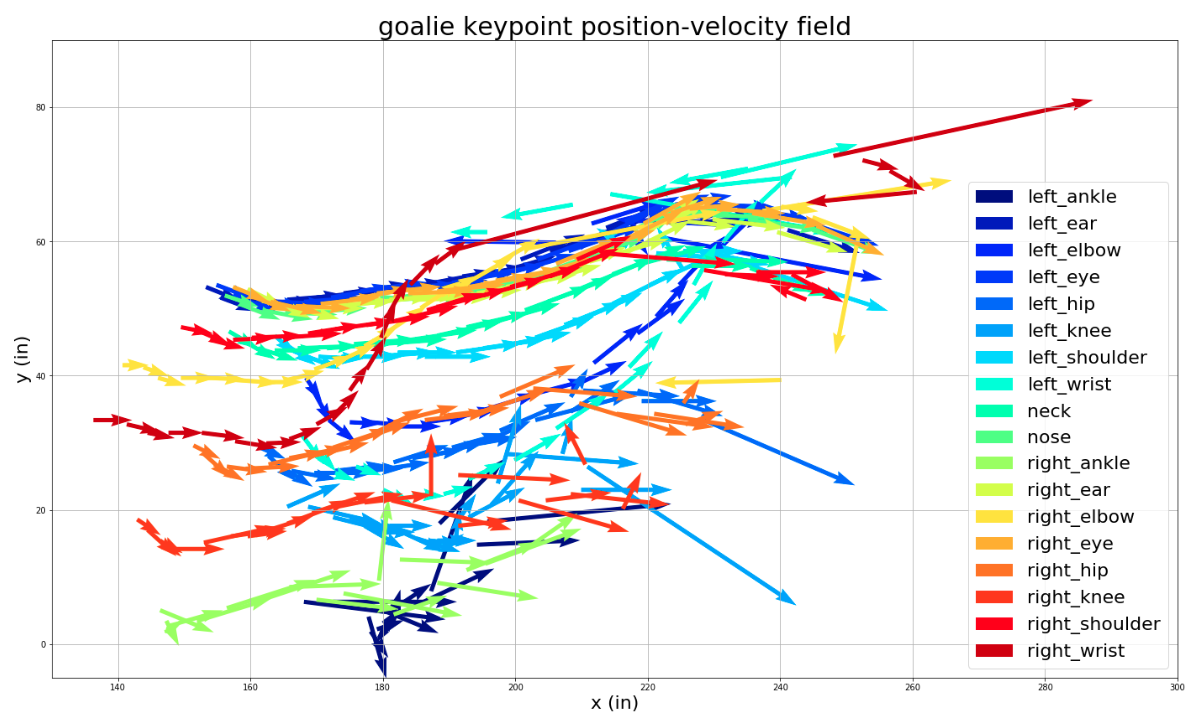
Figure 6: Detailed keypoint position-velocity movement across many body parts.

Figure 7: Keypoint position-velocity movement across select mean aggregated body parts.
Keypoint velocity fields, trajectory plots, and other keypoint focused spatio-temporal plots add value to the training of a goalie in a few ways.
First, comparisons can be made to other goalie motions for similar ball trajectories. For example, we can
imagine building a repository of penalty kick analyses across a large population of athletes with varying skill levels from amateur through to elite athletes. Now, a number of techniques could be employed to match a particular kick with a very similar shot on an elite athlete
perhaps broken down by successful and failed saves. We could then imagine valuable insights gleaned by manually watching carefully, perhaps on how a star sets up for the shot, has special hop or leap movement. We might try to run some automated analysis on the failed vs successful saves to understand what keeper movements work and don’t across a larger number of athletes.
In addition to comparisons across an athlete population, we might help improve performance by objectively tracking a particular keeper’s performance improvement over time. While we’ll likely repeat the population analyses described above on this one athlete, we might also look closely at a specific metric, say the lag from kick initiation to the moment when the goalie commits to his or her response; perhaps after studying a population, we understand there to be an optimal lag length, we can see how this keeper’s deviation from the optimal changes over time.
Next we decided to track specific keypoints like the keeper’s wrist and neck velocity and place them in a video dashboard to understand our metrics more intuitively. By leveraging the output of our semantic segmentation model, we were also able to isolate the ball trajectory and velocity.

Figure 8: Dashboard view depicting visual ball trailers and velocity indications of ball, keeper wrists and neck.
Next we explored the use of a 3D virtual environment. A common principle in design if you want to really focus on or understand something, is to cut out the clutter and unnecessary information. In addition, intuitively we felt there might be an advantage to the player/coach conversation in seeing a shot from a different vantage.

The semantic segmentation and ball trajectory extraction discussed previously enabled us to reconstruct the much simplified virtual scene below where a virtual ball, following the actually kicked trajectory, is shown along with the actual keeper isolated video.
Professional athletes have long had the advantage of analysis from expensive body worn sensors. AI models, when applied to readily available video, however, offer much promise to more cost conscious amateur athletes.
Here at Xyonix, we have built a flexible and ready to use activity analysis platform that not only allows us to easily analyze activities such as a penalty kick or a runner’s gait, but it allows us to repeat similar analyses on the fly from your phone.
Have an activity you think could benefit from a deep AI analysis? Contact us! We’d love to see if we can help you out.
REFERENCES
https://fivethirtyeight.com/features/a-chart-for-predicting-penalty-shootout-odds-in-real-time/
https://www.popularmechanics.com/adventure/sports/a5864/world-cup-penalty-kick-physics/
@abhinav.sagar - Mask R CNN for Self Driving Cars - Medium